
I’ve used other tools for monitoring SQL Server, but this was my first look at SQL Monitor made by Redgate Software.
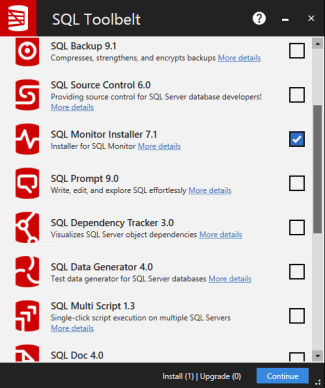
The first step was just to download the software and install it. It comes as part of the Redgate SQL Toolbelt, so I just had to make sure I selected the right tool from the bunch.
After installing, I had to point it to an existing SQL Server where a database would be created, and two services would be set up. Next, I just had to supply the instance that I wanted to monitor.
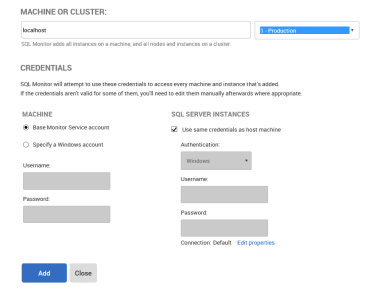
Since I was just setting all this up on a VM for a SQL in the City Streamed session, I installed everything on the same box. In a real production environment, you would probably set up a dedicated server for SQL Monitor. SQL Monitor is made to scale to hundreds of instances, so you don’t want it affecting any instances that you intend to monitor, and I also found that it needs to have enough memory to function properly.
One of the nice things about SQL Monitor, is that you do not need to install any client software. It’s completely web based. I tried it in Edge, IE, and Chrome and found no issues.
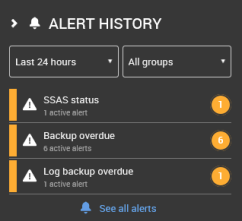
After launching the web page, I saw that it had already picked three problems with my instance! I saw those notifications less than five minutes after downloading the software. I was already impressed!
I spent some time watching videos on the Redgate site and YouTube to learn more about the tool. In this case, since I would be presenting, I wanted to feel confident and not stumble around. I found that once I understood the layout, finding my way around was easy.
If you count the Availability Group alerts, there are about 40 alerts built-in, and you can decide which merit an email notification.
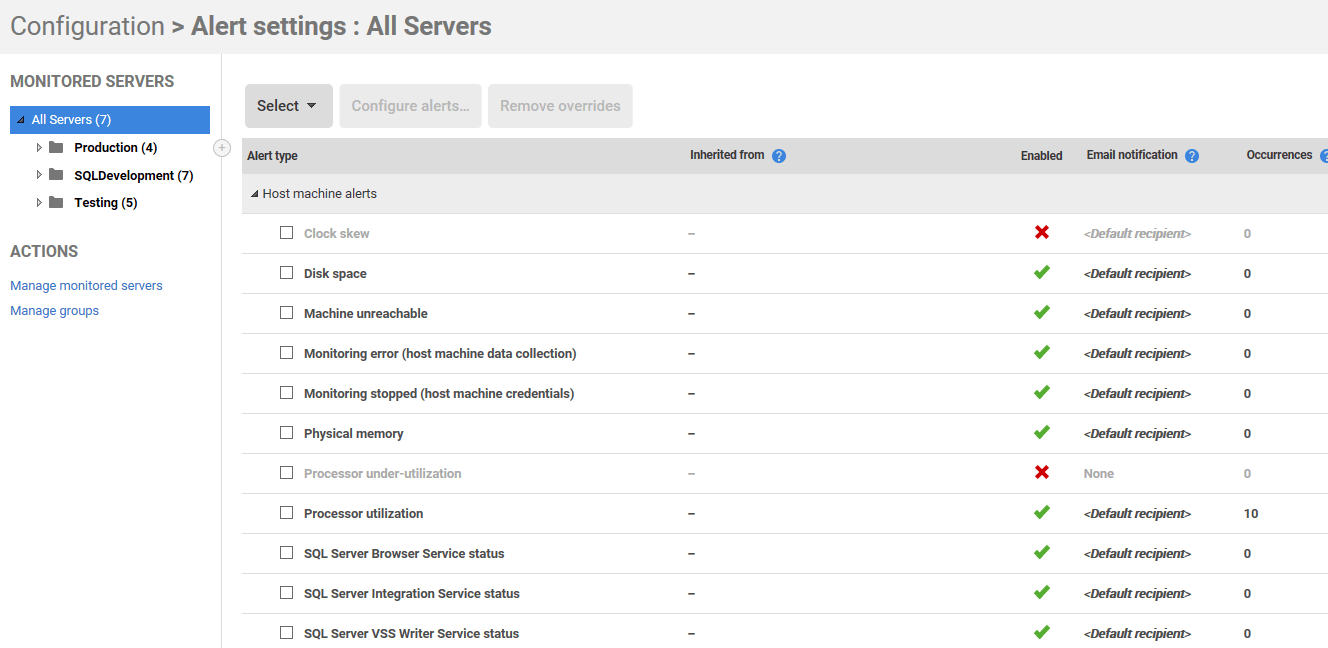
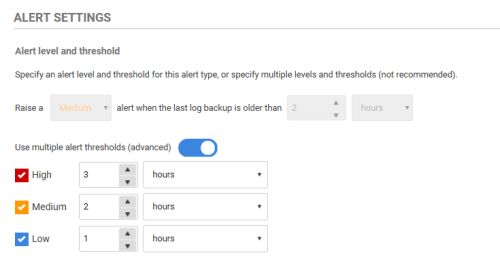
Depending on the alert, you can configure them to meet your own requirements. For example, the “Log Backup Overdue Alert” can be configured for three thresholds. You may want to set different alert levels depending on how long since a transaction backup was performed.
Another very cool feature is the ability to add custom metrics. Many of these were contributed by members of the Friends of Redgate program. I started out with a list of things I want to see in this type of tool. Between the built-in alerts and the available custom-built alerts, I found everything I needed.

For those of you managing large SQL Server estates, be assured that this tool has a fantastic interface for viewing the status of hundreds of instances at once. Here is a look at our demo site which is running live against Redgate’s own production servers. You can play with this all you wish without breaking anything.

Once an alert has been raised, drilling into it gives you quite a bit of information. You’ll see the performance metrics during that time period and a description of the problem. The description will get you started solving the issue.

Overall, I was really impressed with SQL Monitor. It’s simple to install and use. You’ll spend some time making changes to the configuration, but it will start working immediately even if you don’t get to that right away.


My only gripe with the tool is that the reports are not as prompt as I would expect. I have some reports “scheduled” to run at midnight and some days I get the alerts at midnight… other days I get the alerts at 8:00 AM, sometimes 9:00 AM sometimes after noon… worst case was the report never arrived, but those are usually caused by some bad data in one of the widgets as I made custom metric collection and used those in the reports.
But I agree, it is a nice and easy monitoring solution to set up and maintain.
Also, updates are a breeze in both complexity (ie they are simple) and speed. It usually takes me just as long to back up the database than it does to do the update.
Be sure to submit the issue to support to see what they can do to help.