SQL Server Reporting Services (SSRS) has been around since 2004. I learned about it at PASS 2003, and probably had the beta version running as soon as I returned back to work from Seattle. Over the years, I have created many reports at my previous job at the law firm and for some customers since then.
I have been concerned that Microsoft was going to abandon SSRS eventually. For a while, new features were supported in SharePoint only, and new products such as Power BI have been released. I was happy to learn that Microsoft rebooted SSRS with SQL Server 2016. There is a new web portal, support for modern browsers, and a fantastic new feature called Mobile Reports.
Mobile Reports are dashboards that will run on most modern mobile devices as well as within the web portal. They are supported on IOS 9 and later, Android 4.4 or better, and Windows 10. To run Mobile Reports on these devices, the mobile Power BI application must be installed.
At first glance, they are simple to create. There is a new tool to use, the SQL Server Mobile Report Publisher. The tool will look familiar to you if you have worked with Datazen in the past. Microsoft purchased Datazen in 2015.

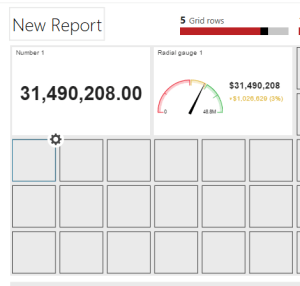
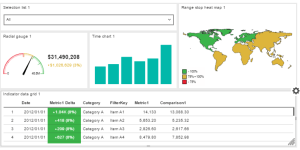
In my opinion, creating dashboards is simpler with Mobile Reports than with traditional paginated SSRS reports. I have never been comfortable with the gauge control in SSRS. It’s simple to set up in a Mobile Report.
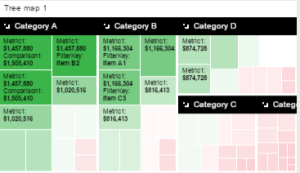
There are several chart types, and each one is configured a bit differently. I spent quite a bit of time figuring them out for my Pluralsight course. The tree map, one of the chart types, is the most complex control.